AMR Phenotypes
Overview
The AMR Phenotypes Tab provides a tabular view of all of the bacterial AMR phenotype data for the selected taxon level, including the resistance phenotype (Resistant, Susceptible, Intermediate) and/or the minimum inhibitory concentration (MIC) value as measured by antibiogram (AMR panel) assay.
See also
Accessing AMR Phenotypes
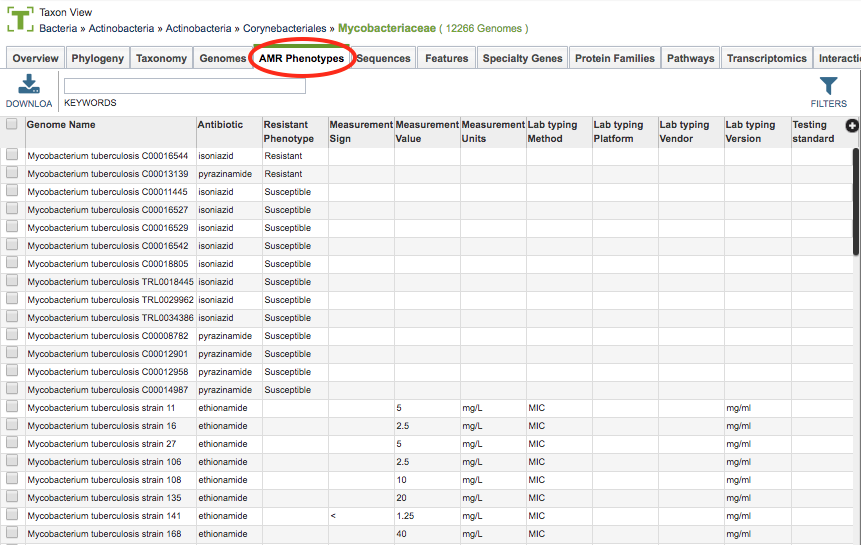
Clicking the AMR Phenotypes Tab in a Taxon View displays a table with rows for each genome/antibiotic combination for which there is an AMR phenotype designation or MIC value in that taxonomic level, as shown below:
AMR Phenotypes Table
 The table provides a listing of Resistance Phenotype (Susceptible, Resistant, Intermediate) for each of the tested antibiotics/chemicals associated with each genome. Where available, additional panel data are provided such as MIC information (Measurement Sign, Measurement Value, Measurement Units, Testing Standard, Testing Standard Year). Additional fields for Lab Typing information (Method, Platform, Vendor, Version) and Source are also available.
Predicted AMR Phenotypes
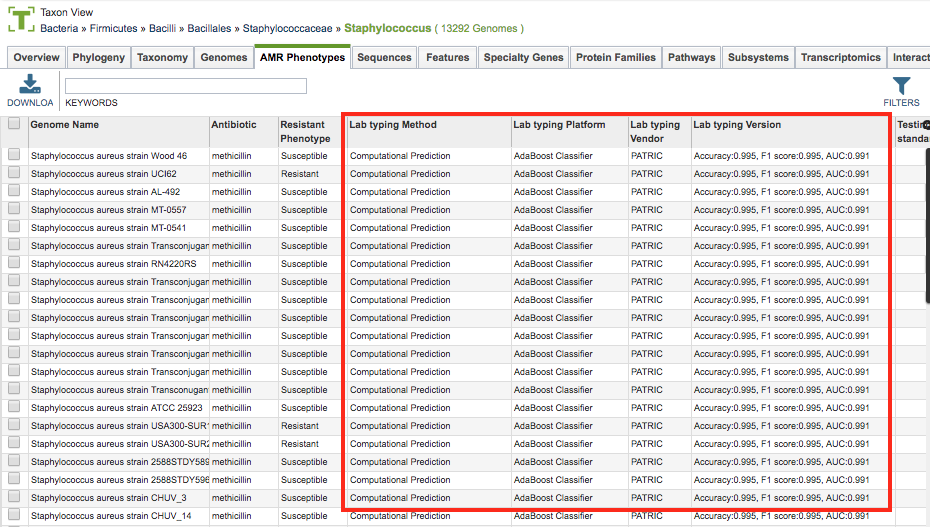
 The Bacterial Genome Annotation Service provides predictions of AMR Phenotypes for genomes for which AMR classifiers have been built For these predicted phenotypes, the Lab Typing Method will be “Computational Prediction”, the Lab Typing Platform will show the classifier type (e.g., “AdaBoost Classifier”), The Lab Typing Vendor will show the source of the classifier producer, and the Lab Typing Version will show the accuracy and other scores associated with the prediction (e.g., “Accuracy:0.995, F1 scroe:0.995, AUC:0.991”).
See Davis, JJ, et al. 2016 and AdaBoost Classification Software for more information on how AMR classifiers are constructed and used.
AMR Phenotypes Table Tools
Within this table you may do the following:
Download the entire contents of the table in text, CSV, or Excel format by clicking the Download button above the table on the left side.
Rearrange and narrow the list of genomes in the table via sorting (using column headers), keywords (using the Keyword box), and filtering (using the Filters tool).
Filter Tool
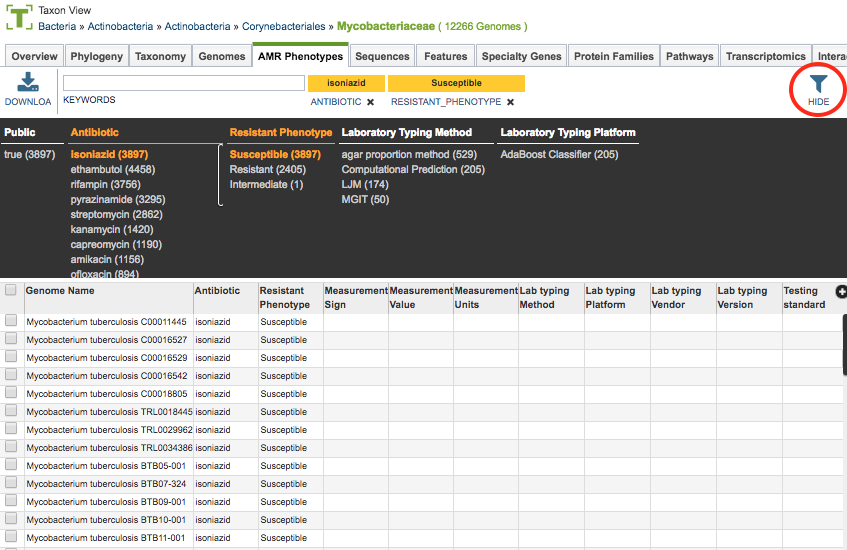
As with all tables, the Filters tool is available to narrow the display of the items in the table, show below:

Clicking on the Filters button at the top right of the table opens the Filter Panel above the table, displaying column names from the table and values for those columns with counts of occurence. Clicking on the filter values narrows the genomes displayed in the table to those matching the chosen filter values. Clicking the Hide button closes the Filter Panel. More details are available in the Tables and Filters Quick Reference Guide.